Using the Data Viewer in the RStudio IDE

Follow

Introduction

The RStudio IDE includes a data viewer that allows you to look inside data frames and other rectangular data structures. The viewer also allows includes some simple exploratory data analysis (EDA) features that can help you understand the data as you manipulate it with R.

Starting the viewer

You can invoke the viewer in a console by calling the View function on the data frame you want to look at. For instance, to view the built-in iris dataset, run these commands:

> data(iris)
> View(iris)

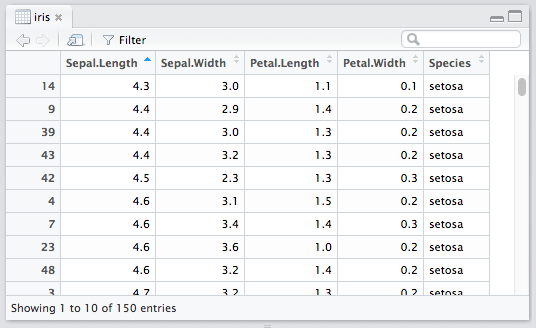
You can also start the viewer by clicking on the table data icon on the right, in the environment pane:

Sorting

As you might expect, you can sort by any column by just by clicking on the column. Click on a column that’s already sorted to reverse the sort direction.

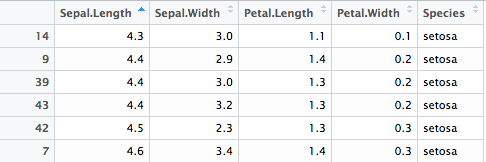
To remove sorting and show the data in the order R sees it, click the empty cell in the upper left.

Filtering

To apply filters, click the Filter icon in the toolbar. Any field that can be filtered will have a white box labeled All. Click this box to change which field values you want to see. For instance, to filter out irises with a sepal width greater than 3.6:

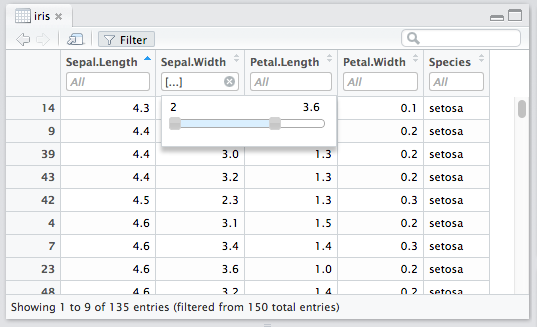
Note the text on the bottom, which indicates how many records the dataset contained before and after filtering; in this case we’ve filtered 150 records down to 135.

Not all kinds of fields can be filtered. At the moment, only the following types are supported:

  • Numeric
  • Character
  • Factor (treated as character if > 256 levels)
  • Boolean (logical)

Filters are additive (i.e. joined with AND); that is, if you apply two column filters, you will see only records that match both of them.

Clear individual filters by clicking the (x) next to the filter; to clear all the filters at once, click the Filter icon in the toolbar.

Searching

You can search for text across all the columns of your frame by typing in the global filter box:

The search feature matches the literal text you type in with the displayed values, so in addition to searching for text in character fields, you can search for e.g. TRUE or 4.6 and see results in logical and numeric field types.

Searching and filtering are additive; when both are applied, you will see only records that match your filters and contain your search text.

Advanced topics

Auto-refreshing

In most cases the viewer will automatically refresh itself if it detects that the underlying data has changed. For instance, try this:

> data(Orange)
> View(Orange)
> Orange[1, "age"] <- 120

You’ll see the age of the first tree change from 118 to 120 in the viewer.

This auto-refreshing feature has some prerequisites, so if it doesn’t seem to be working:

You must call View() on a variable directly. If, for instance, you call View(as.data.frame(foo)) or View(rbind(foo, bar)), you’re invoking View() on a new object created by evaluating your expression, and while that object contains data, it’s just a copy and won’t update when foo and bar do.

The variable must be on an environment in the search path, ideally in the global environment.

Auto-refreshing works even when the data viewer is popped out into its own window, so this is a good way to take advantage of a multi-monitor setup!

Labels

The viewer supports column labels, such as those attached by the Hmisc package and by SPSS import from haven and others. Try this:

> library(Hmisc)
> data(women)
> label(women[[1]]) <- "Woman's Height"
> label(women[[2]]) <- "Woman's Weight"
> View(women)

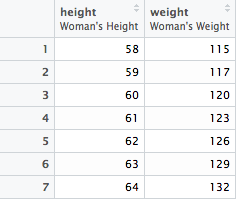
Both the label attribute on individual columns and the variable.labels attribute on the outer frame are supported.

Restrictions and Performance

The number of rows the viewer can display is effectively unbounded, and large numbers of rows won’t slow down the interface. It uses the DataTables JavaScript library to virtualize scrolling, so only a few hundred rows are actually loaded at a time.

While rows are unbounded, columns are capped at 100. It’s not currently possible to virtualize columns in the same way as rows, and large numbers of columns cause the interface to slow significantly.

Finally, while we’ve made every effort to keep things speedy, very large amounts of data may cause sluggishness, especially when a sort or filter is applied, as this requires R to fully scan the frame. If you’re working with large frames, try applying filters to reduce it to the subset you’re interested in to improve performance.

Saving filters

At this time it’s not possible to extract the “current view” as an R object, or to save the manipulations therein as an R script; the data viewer is a feature designed to help you during exploratory data analysis and does not aim to produce a reproducible transformation.

In a future release, we may add the ability to export the transformations as e.g. a dplyr script.

Comments

  • Avatar
    Oliver Brendel

    Wow, this new viewer with filters and labels is really great. It is just a pity that filtering of time variables is not working in the moment. And that the "units" value is not shown, event if it is set to true in "label"

  • Avatar
    Paul Rougieux

    This new Viewer is great to explore data. It seems there is an issue with dplyr grouped tables when filtering on character vectors. Try for example:

    library(dplyr)
    irisgrouped <- iris %>% mutate(Species = as.character(Species)) %>% group_by(Sepal.Length)

    Then in the viewer sort by Species.

  • Avatar
    Americo Zuzunaga

    The new viewer is great! However, it cuts off columns after a certain number of characters (it would appear after 45 characters). Is there a way to change this behavior?

  • Avatar
    david

    It will not show columns after about 100.
    http://stackoverflow.com/questions/19341853/r-view-does-not-display-all-columns-of-data-frame

    One possible improvement without too much performance penalty could be have a column range selector in data viewer. Using a bar with segments to represent all columns, click to highlight the columns will be shown, multi select to select multi segments -- you probably want to keep the first several columns when you select the end columns.

    For 100ish columns, the segments could be 10 or 20 for each selection so the selection need to be too fine grained.

  • Avatar
    Tomy George

    Very readable explanation of the excellent features! My wish: If I could sort on multiple columns at a time...

  • Avatar
    John Endahl

    Tomy, your wish is granted. Click on the primary column, then hold down the shift key and click on a secondary column.

  • Avatar
    Tomy George

    Wow! Thanks a lot.

    Didn't know what I did earlier. May be I tried ctl + shift, my windows habit. My bad.

  • Avatar
    jake riley

    The filter is a great tool and has been helpful in finding errors and thinking through exploratory analysis. I wish the slider bar worked a bit differently. Sometimes the range of numbers is very large and it is hard get into a specific range. This is especially noticeable when I've filtered the values to something like "Low" and that limits the range of numbers now available to view but the slider bar is still showing the whole range of numbers. I hope you'll consider this edit in future releases of RStudio.

  • Avatar
    Paul Obrecht

    The filter is a great tool. I often use it for data exploration. It has saved me countless hours.

    The handling of non-alphanumeric characters seems a bit unpredictable. For instance, when trying to filter character variables that contain special characters, minus signs are fine but plus signs return no results. I'm looking at text-strings like "IFNg+IL2-TNFa+". I can filter on the "IL2-" substring, but trying to filter on the "IFNg+" substring results in an empty view with a caption "Showing 0 to 0 of 0 entries," even if I trying quoting and escaping the + every way I can think of.

  • Avatar
    Oliver Huber

    The viewer is great indeed! One question though: Is there a shortcut to show a data frame in the Viewer that is currently selected within the code editor, i.e., a shortcut for the console command "View(my_dataframe)"? That would be very handy.

  • Avatar
    RJW

    The viewer is really helpful - but the fact that it is limited to only 100 columns is REALLY inconvenient and decreases its usefulness very much! I would be very happy if this issue could be worked on and the viewer would be able to show all my data!
    Thank you very much!

  • Avatar
    Tian

    The Rstudio view can not display data, just blank and some NAs. utils::view () do work. I tried reinstalling Rstudio, but it didn't work. What should I do?

  • Avatar
    Arthur Yip

    I understand the current limit is 100 variables. While you work hard to improve that, could you please implement a warning when trying to View() more than 100 that tells us the remaining variables have been cut off (like the Showing 1 to x of y entries message)?

    Thanks!

  • Avatar
    Jonathan McPherson

    We've removed the 100 variable limit in the RStudio daily builds (will become a preview in a few weeks). You can give it a try here:

    http://dailies.rstudio.com/

  • Avatar
    Katie Burnham

    I have the same problem as Tian above - clicking on a data frame in my environment displays a blank table with only NA values if present. Using utils::view(my.data.frame) gives me a pop-out window as expected. This problem only started a week or two ago, and I've reinstalled R and RStudio with no success. I'm using R v3.4 and RStudio v1.0.143 on a Windows machine.

  • Avatar
    Angelo Fraietta

    I am also having same problem - It just started happening. I know the data is there because looked in the html source.

    Looking at source, the NA cells have which shows up in gridstyles CSS as
    .naCell {
    color: #b0b0b0;
    font-style: italic;
    }

    The cells that are blank have no colour in css for them
    .numberCell, .textCell {
    max-width: 300px;
    white-space: nowrap;
    overflow: hidden;
    text-overflow: ellipsis;
    }

  • Avatar
    Jonathan McPherson

    Angelo, thanks, that's very helpful! We haven't been able to reproduce this in house yet but hope to have a solution soon.

  • Avatar
    Angelo Fraietta

    I have resolved this

    I edited file C:\Program Files\RStudio\resources\grid

    .numberCell, .textCell {
    max-width: 300px;
    white-space: nowrap;
    overflow: hidden;
    text-overflow: ellipsis;
    color: #000000;
    }

    Works fine now

  • Avatar
    Jonathan McPherson

    Katie, Angelo, we have a preview release which should fix this issue. Could you give it a try and let us know if it resolves the problem for you?

    https://www.rstudio.com/products/rstudio/download/preview/

    Jonathan.

  • Avatar
    Katie Burnham

    Hi Jonathan, thanks, the data viewer now works for me with the preview release.
    Katie

  • Avatar
    david

    The release notes of preview v1.1.353 mentioned "F2 in source editor opens data frame under cursor in a new tab", however nothing happens when I tried it?

  • Avatar
    Emil Bellamy Begtrup-Bright

    Is it possible to invoke a command so that the dataviewer starts in a new window instead of inside Rstudio? I almost always point-and-click to do this when viewing my data, so that would remove a whole step in the proces, and a proces which involves using the mouse (= less RSI) to boot! Thank you.

  • Avatar
    Will Tudor-Evans

    Hi, I recently installed Rstudio on a different computer where I don't seem to be able to view Lists as Tables in the Data Viewer. Previously when I clicked on the list in the Environment it would display it in the Data Viewer as a table with rows and columns, now it just seems to be a collapsible list of sub categories, similar to what happens if you click on the blue arrow next to the list in the environment. Is there any way to still see the list as a table in the Data Viewer?

  • Avatar
    Jonathan McPherson

    Will, try coercing to a data frame first -- i.e. View(as.data.frame(your_obj)).

  • Avatar
    Will Tudor-Evans

    Thanks Jonathan, yeah that does it, it's just not as convenient as being able to click the list in the Environment and have it pop up. Typing it out each time is 10x the time.

  • Avatar
    Bruce Granger

    I would like to filter a variable (column) for all values that are not null (i.e., !is.na), is this possible?